
问题标题
VTable集成VChart图表场景下,边缘处的圆点被截断怎么处理?
问题描述
VTable集成VChart图表场景下,绘制图表上点时怎么规避边缘位置的点被截断的情况。
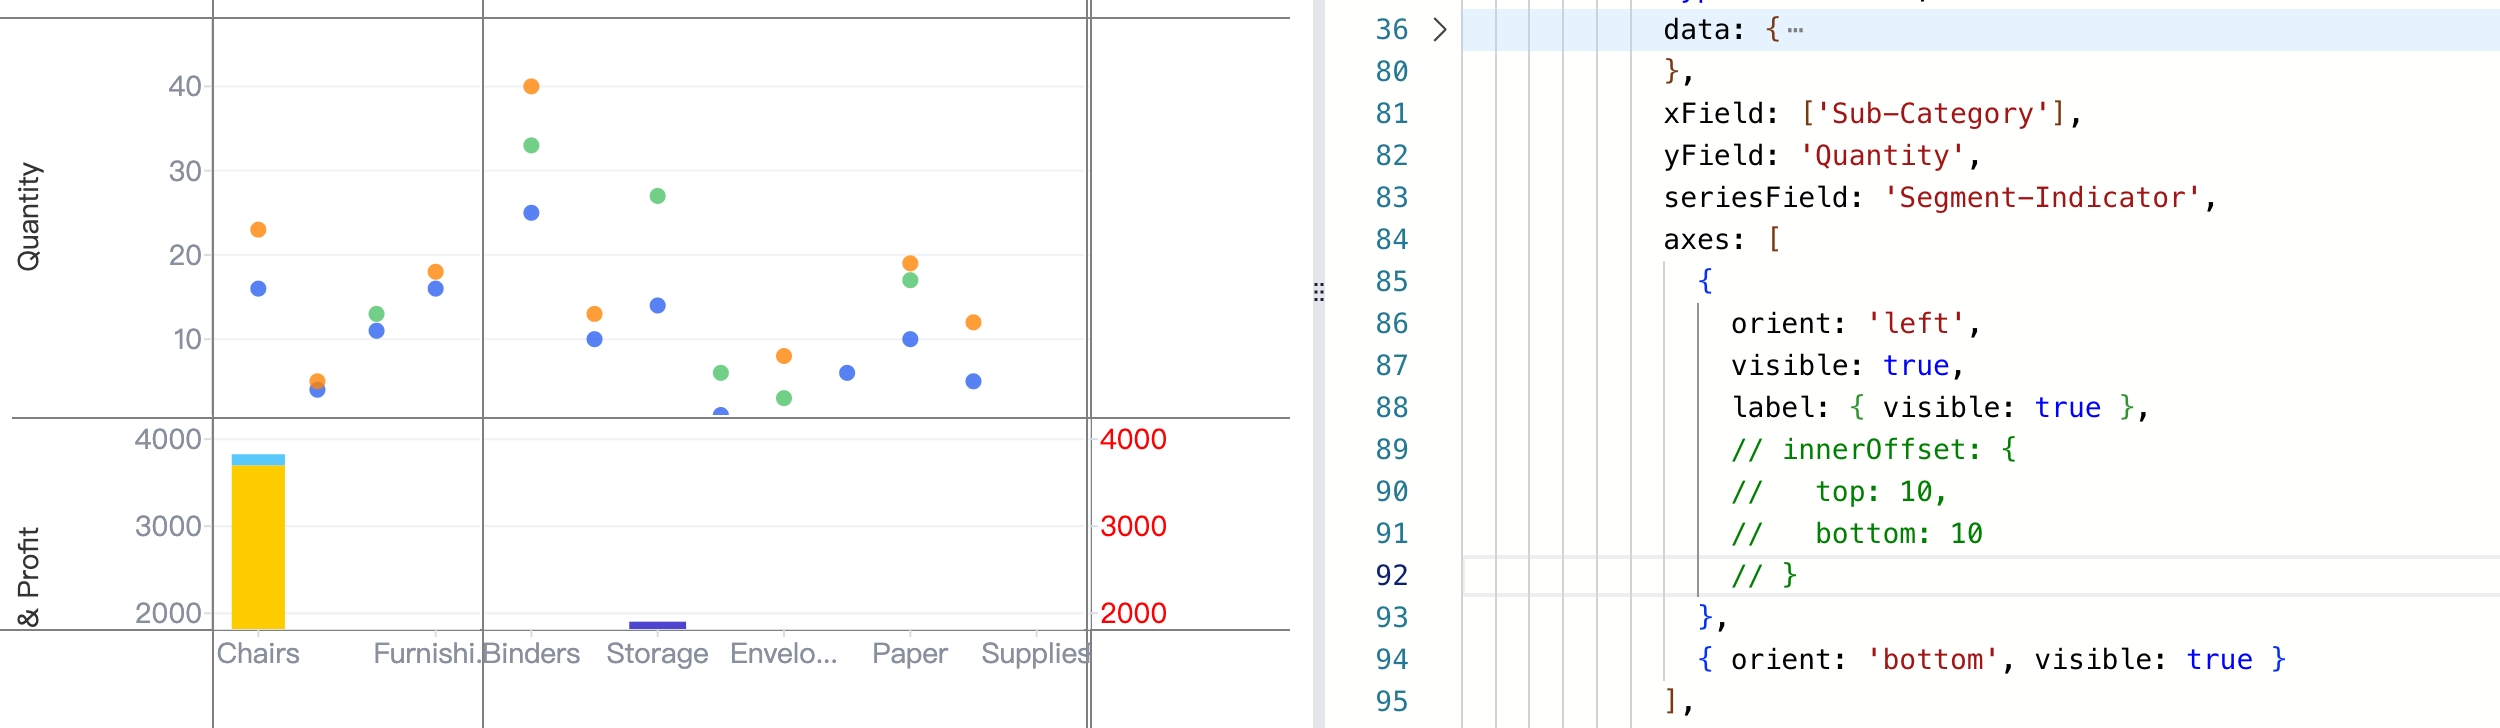
解决方案
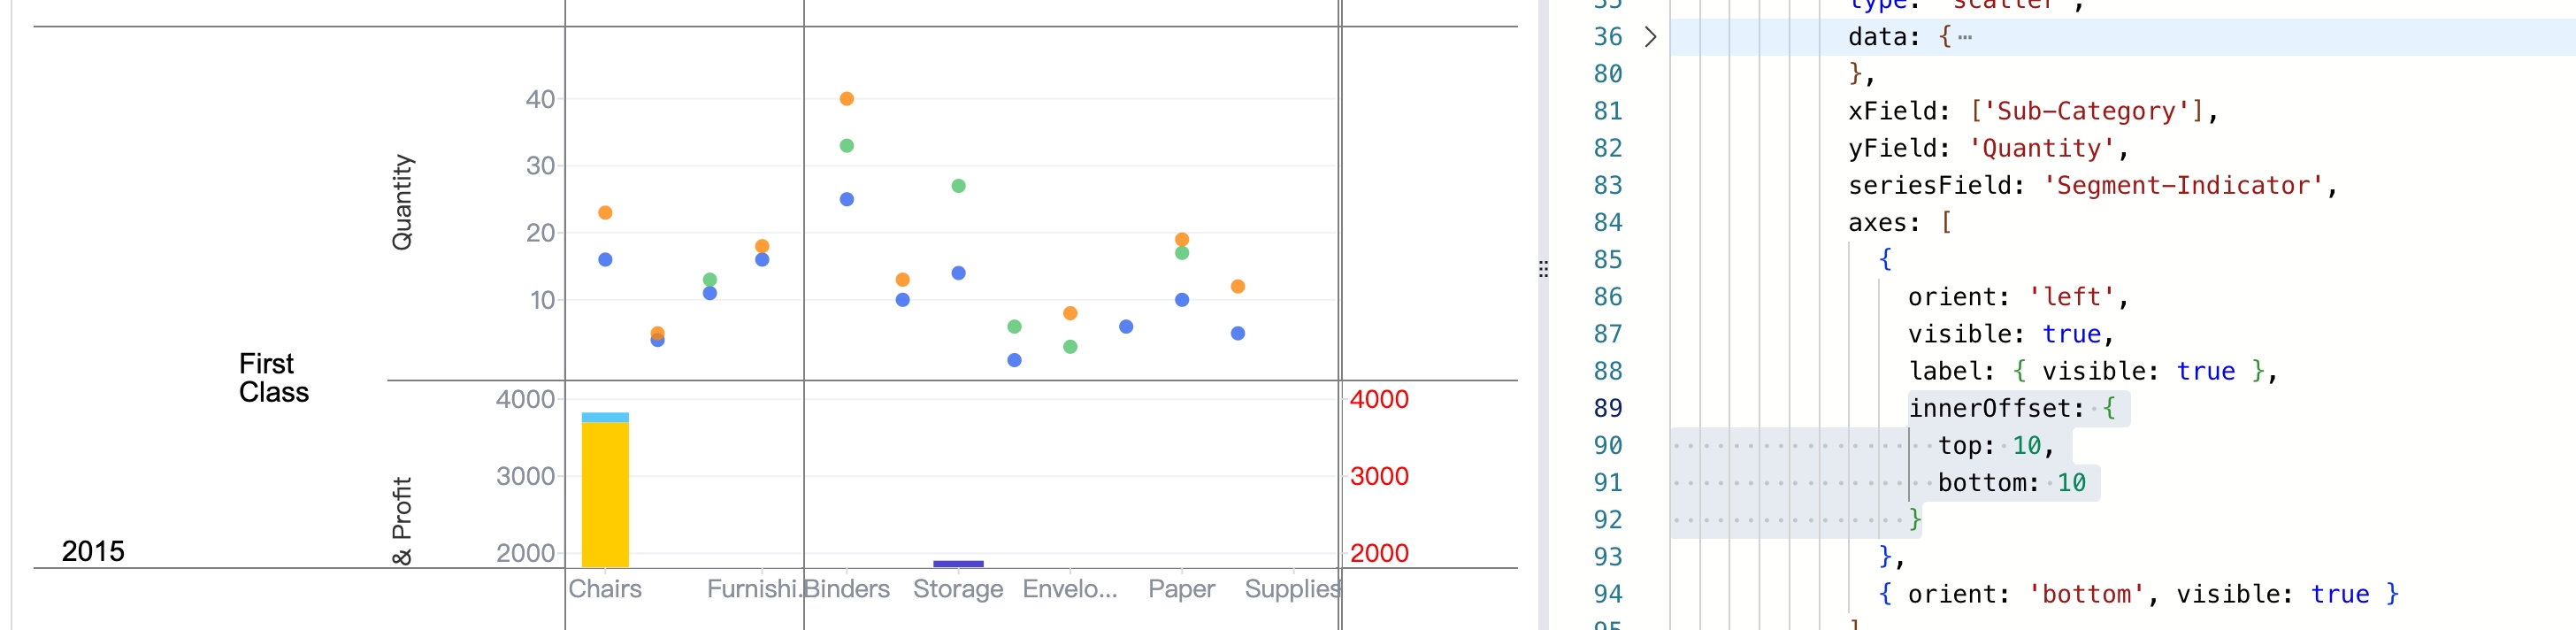
axes轴上配置innerOffset,如上加上之后图表上元素与表格边缘就有一定的间距了。
代码示例
const option = {
  axes: [
          {
            orient: 'left',
            type: 'linear',
            innerOffset: {
              top: 4,
              bottom: 4,
            }
          },
          {
            orient: 'bottom',
            type: 'band',
            innerOffset: {
              left: 4,
              right: 4,
            }
          }
        ]
  ...
}

const tableInstance = new VTable.ListTable(container, option);</br>
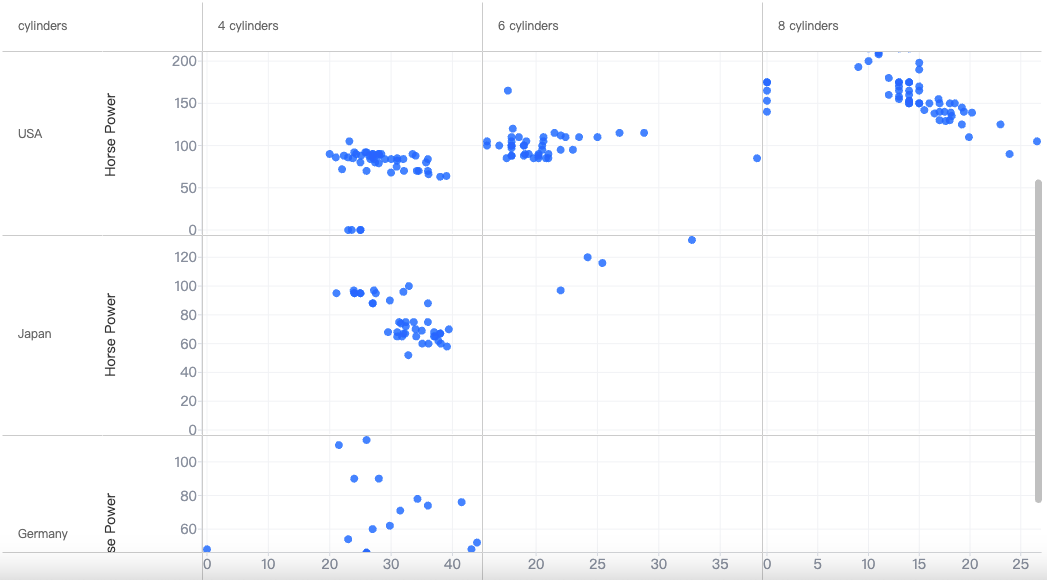
结果展示
在线效果参考:https://visactor.io/vtable/demo/table-type/pivot-chart-scatter
相关文档
相关api:https://visactor.io/vtable/option/PivotTable#axes
github:https://github.com/VisActor/VTable